

Top 10 Charts Data Visualization Icon PowerPoint Presentation Templates in 2026
Charts are an essential component of data visualization in PowerPoint presentations, allowing presenters to convey complex information in a clear and engaging manner. By transforming raw data into visual representations, charts enable audiences to grasp trends, comparisons, and patterns at a glance. Various types of charts, such as bar, line, pie, and scatter plots, serve different purposes and can be customized to fit the specific needs of the presentation. For instance, bar charts are effective for comparing quantities across categories, while line charts excel in illustrating changes over time.Incorporating charts into PPT presentations enhances the storytelling aspect of data, making it easier for the audience to connect with the information being presented. Furthermore, the ability to edit and customize these charts allows presenters to tailor their visuals to match their branding or thematic elements, ensuring a cohesive look throughout the presentation. By using colors, labels, and annotations strategically, presenters can highlight key data points and insights, guiding their audience through the narrative. Overall, charts play a pivotal role in data visualization, enhancing comprehension and retention, and making presentations more impactful and memorable.


Visual Bar Chart Data Analytics Icon
Presenting our set of slides with Visual Bar Chart Data Analytics Icon. This exhibits information on three stages of the process. This is an easy to edit and innovatively designed PowerPoint template. So download immediately and highlight information on Analytics Icon, Visual Bar Chart Data.

Try Before you Buy Download Free Sample Product
 Save Hours of Time
 100% Editable
 Compatible with Google Slides
-
Product Description

-
Our Visual Bar Chart Data Analytics Icon are topically designed to provide an attractive backdrop to any subject. Use them to look like a presentation pro.
-
Related keywords
Data visualization icon with multiple charts
Presenting this set of slides with name Data Visualization Icon With Multiple Charts. The topics discussed in these slide is Data Visualization Icon With Multiple Charts. This is a completely editable PowerPoint presentation and is available for immediate download. Download now and impress your audience.
Try Before you Buy Download Free Sample Product
Save Hours of Time
100% Editable
Compatible with Google Slides
-
Product Description
-
Our Data Visualization Icon With Multiple Charts are topically designed to provide an attractive backdrop to any subject. Use them to look like a presentation pro.
Data visualization icon pie chart and magnifying glass
Presenting this set of slides with name - Data Visualization Icon Pie Chart And Magnifying Glass. This is a three stage process. The stages in this process are Data Visualization Icon, Data Management Icon.
Try Before you Buy Download Free Sample Product
Save Hours of Time
100% Editable
Compatible with Google Slides
-
Product Description
-
Improve your image in the eyes of the customer with our Data Visualization Icon Pie Chart And Magnifying Glass. It will increase goodwill.
Data visualization icon four pie chart bar graph upward lines
Presenting this set of slides with name - Data Visualization Icon Four Pie Chart Bar Graph Upward Lines. This is a one stage process. The stages in this process are Data Visualization Icon, Data Management Icon.
Try Before you Buy Download Free Sample Product
Save Hours of Time
100% Editable
Compatible with Google Slides
-
Product Description
-
Energise your team into action. Plug them in with our Data Visualization Icon Four Pie Chart Bar Graph Upward Lines.
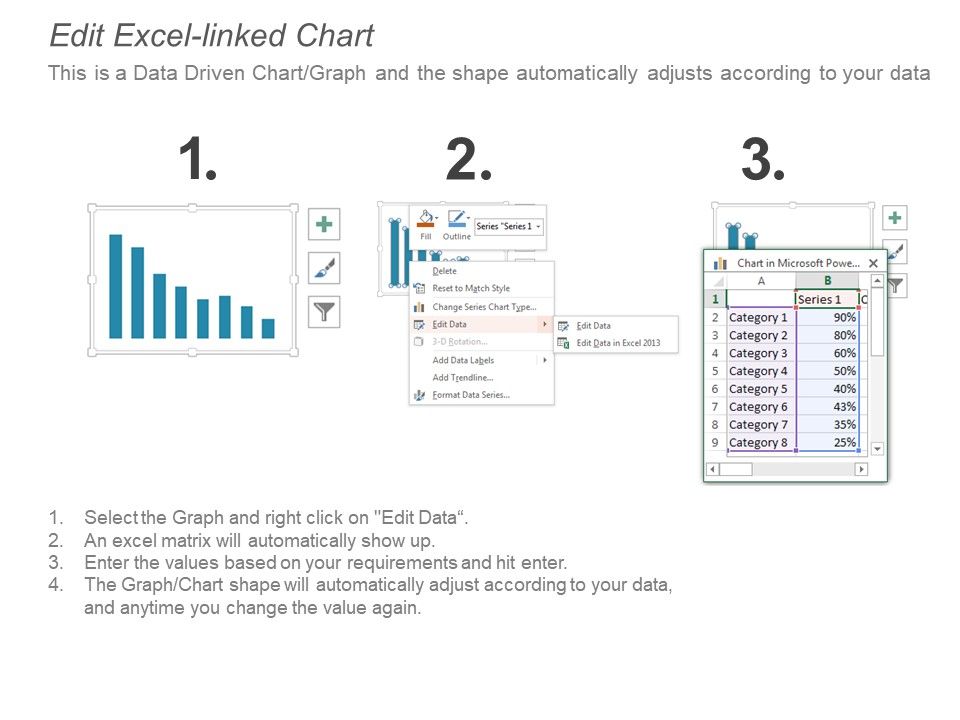
Data Visualization Graph Chart Monotone Icon In Powerpoint Pptx Png And Editable Eps Format
This Monotone powerpoint icon on Graph Chart is an ideal choice for presentations, reports, and other documents. It is a simple and effective way to visualize data and make it easier to understand. It is a great tool for data analysis and can be used to compare trends, illustrate relationships, and more.
Try Before you Buy Download Free Sample Product
Save Hours of Time
100% Editable
Compatible with Google Slides
-
Product Description
-
This Data visualization graph chart monotone icon in powerpoint pptx png and editable eps format is a 100 percent editable icon. The downloaded file will have this icon in EPS, PNG and Powerpoint pptx format and is perfect for your next project. It has a simple yet stylish design.
Data Visualization Graph Chart Colored Icon In Powerpoint Pptx Png And Editable Eps Format
This coloured PowerPoint icon on Graph Chart is a great way to visually represent data. It is easy to customize and can be used to create stunning visuals for presentations. It is a great tool to help you communicate complex information in a simple and effective way.
Try Before you Buy Download Free Sample Product
Save Hours of Time
100% Editable
Compatible with Google Slides
-
Product Description
-
Use this Data visualization graph chart colored icon in powerpoint pptx png and editable eps format and create amazing PowerPoint presentations or graphics with ease. This downloaded file is available in all the editable formats such as EPS, PNG and Powerpoint pptx.

Visualization Research Branches Google Charts Tool For Data Visualization
This slide depicts google charts as the tool for data visualization, which can extract data from various sources, including SQL, databases, google sheets. Increase audience engagement and knowledge by dispensing information using Visualization Research Branches Google Charts Tool For Data Visualization. This template helps you present information on five stages. You can also present information on Popular Free Alternative, Dynamic Data Visualizations, Technology using this PPT design. This layout is completely editable so personaize it now to meet your audiences expectations.
Try Before you Buy Download Free Sample Product
Save Hours of Time
100% Editable
Compatible with Google Slides
-
Product Description
-
This slide depicts google charts as the tool for data visualization, which can extract data from various sources, including SQL, databases, google sheets.
-
Related keywords


Four stages data visualization through doughnut charts
Presenting this set of slides with name - Four Stages Data Visualization Through Doughnut Charts. This is a four stage process. The stages in this process are Data Visualization, Data Management, Data Representation.
Try Before you Buy Download Free Sample Product
Save Hours of Time
100% Editable
Compatible with Google Slides
-
Product Description
-
Arrive at a compromise formula with our Four Stages Data Visualization Through Doughnut Charts. Get former foes to agree to be friends.
-
Related keywords
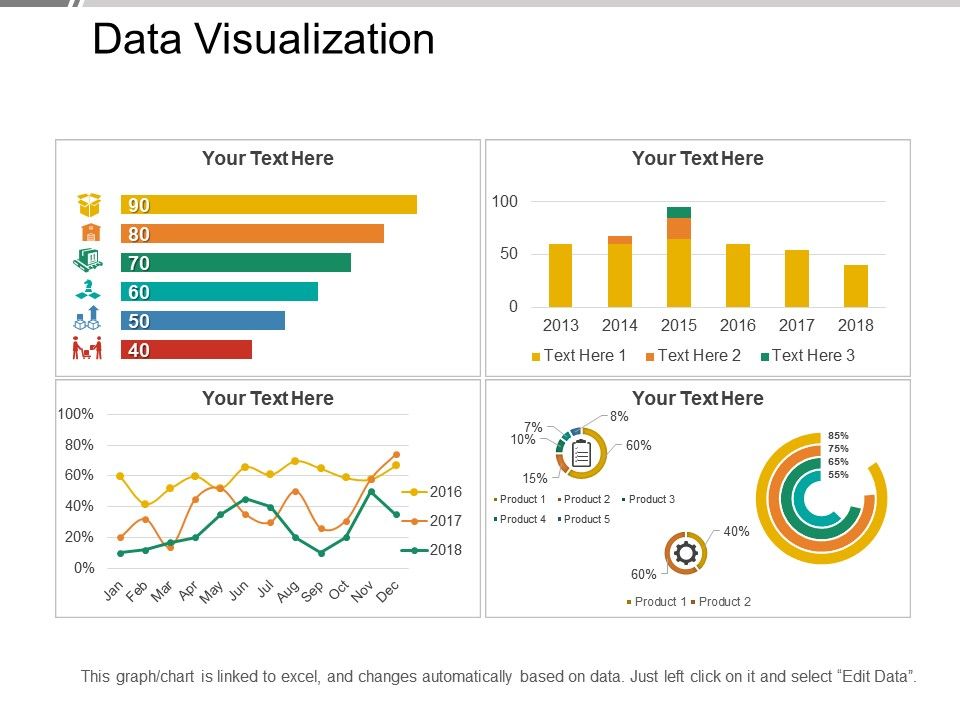

Data visualization
Presenting this Data Visualization PowerPoint slide. This PPT presentation is Google Slides compatible hence it is easily accessible. You can download and save this PowerPoint layout in different formats like PDF, PNG, and JPG. This PPT theme is available in both 4:3 and 16:9 aspect ratios. As this PowerPoint template is 100% editable, you can modify color, font size, font type, and shapes as per your requirements.
Try Before you Buy Download Free Sample Product
Save Hours of Time
100% Editable
Compatible with Google Slides
-
Product Description
-
Use this Data Visualization PowerPoint presentation to communicate the company data to your employees. The quantitative data can be conveyed by using dots, lines, or bars, using this data visualization PPT layout. By using this visualization tools PowerPoint theme, the trends, outliers, and patterns in data can be identified with the help of a bar chart, histogram, scatterplot, Gantt chart, line chart, heat map, matrix, pie chart, etc. Professionals in fields of government, finance, marketing, history, consumer goods, service industries, education, sports and researchers can employ this statistical graphics PPT theme. The data analysis of the company can be effectively depicted using this descriptive statistical PowerPoint template. The advantages of data visualization can be discussed with your employees using this graphical PPT theme. You can explain the complex data in easy to understand manner using this statistical PowerPoint template. Hence download this data interpretation PPT layout to make large data sets coherent to different variables.


Data visualization online business reports charts and analysis
Presenting this set of slides with name - Data Visualization Online Business Reports Charts And Analysis. This is a two stage process. The stages in this process are Data Visualization, Data Management, Data Representation.
Try Before you Buy Download Free Sample Product
Save Hours of Time
100% Editable
Compatible with Google Slides
-
Product Description
-
Discourage attempts to ignore facts with our Data Visualization Online Business Reports Charts And Analysis. Get folks to confront the issue.
-
Related keywords