

Top 10 Client data and analytics insights report icon PowerPoint Presentation Templates in 2026
The Client Data and Analytics Insights Report icon serves as a pivotal element in presentations that aim to convey vital information regarding client performance and market trends. This icon visually represents the synthesis of data collected from various sources, allowing stakeholders to quickly grasp the essence of analytics without delving into complex spreadsheets or lengthy reports. When integrated into PowerPoint presentations, it enhances the overall aesthetic while providing a clear indication of the analytical content being discussed.Utilizing this icon in your PPT can help streamline communication during client meetings, strategy sessions, or internal reviews. It signifies the importance of data-driven decision-making, emphasizing that insights are not just numbers but actionable intelligence. By employing this icon, presenters can effectively highlight key findings, trends, and recommendations derived from client data, fostering a more engaging and informative dialogue. Moreover, the versatility of this icon allows it to be adapted for various contextsbe it showcasing quarterly performance metrics, analyzing customer behavior, or presenting market research findings. Ultimately, the Client Data and Analytics Insights Report icon is an essential tool for any professional looking to elevate their presentations and drive impactful discussions around data insights.


Client Data And Analytics Insights Report Icon
Introducing our premium set of slides with Client Data And Analytics Insights Report Icon. Ellicudate the three stages and present information using this PPT slide. This is a completely adaptable PowerPoint template design that can be used to interpret topics like Customer Analytics, Insights Report Icon. So download instantly and tailor it with your information.

Try Before you Buy Download Free Sample Product
 Save Hours of Time
 100% Editable
 Compatible with Google Slides
-
Product Description

-
Our Customer Analytics Insights Report Icon are topically designed to provide an attractive backdrop to any subject. Use them to look like a presentation pro.
-
Related keywords


Integrated business planning insights reporting and analytics
Presenting this set of slides with name - Integrated Business Planning Insights Reporting And Analytics. This is a eight stage process. The stages in this process are Integrated Planning, Integrated Business Planning, Strategic Management.
Try Before you Buy Download Free Sample Product
Save Hours of Time
100% Editable
Compatible with Google Slides
-
Product Description
-
Collate the information with our Integrated Business Planning Insights Reporting And Analytics. Figure out the aspects that actually concern you.
-
Related keywords
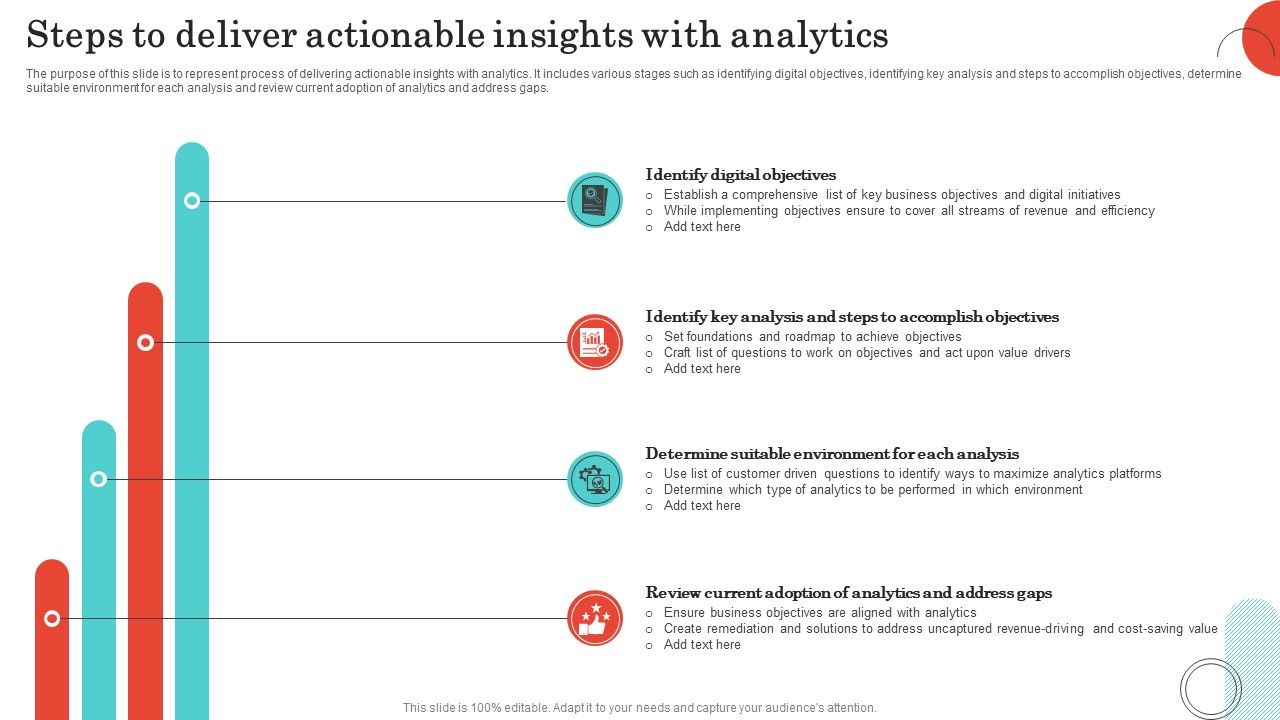
Steps To Deliver Actionable Insights With Analytics
The purpose of this slide is to represent process of delivering actionable insights with analytics. It includes various stages such as identifying digital objectives, identifying key analysis and steps to accomplish objectives, determine suitable environment for each analysis and review current adoption of analytics and address gaps. Introducing our premium set of slides with Steps To Deliver Actionable Insights With Analytics. Ellicudate the four stages and present information using this PPT slide. This is a completely adaptable PowerPoint template design that can be used to interpret topics like Digital, Objectives, Environment. So download instantly and tailor it with your information.
Try Before you Buy Download Free Sample Product
Save Hours of Time
100% Editable
Compatible with Google Slides
-
Product Description
-
The purpose of this slide is to represent process of delivering actionable insights with analytics. It includes various stages such as identifying digital objectives, identifying key analysis and steps to accomplish objectives, determine suitable environment for each analysis and review current adoption of analytics and address gaps.
-
Related keywords


Analytics And Report Insights Enhancing Operational Efficiency Ppt Template
The following slide showcases dashboard to track flight performance KPIs. It includes various KPIs such as Idle air carriers, passenger load factor, total employees, etc.Deliver an outstanding presentation on the topic using this Analytics And Report Insights Enhancing Operational Efficiency Ppt Template. Dispense information and present a thorough explanation of Analytics Report Insights, Origin Destination, Ticket Price using the slides given. This template can be altered and personalized to fit your needs. It is also available for immediate download. So grab it now.
Try Before you Buy Download Free Sample Product
Save Hours of Time
100% Editable
Compatible with Google Slides
-
Product Description
-
The following slide showcases dashboard to track flight performance KPIs. It includes various KPIs such as Idle air carriers, passenger load factor, total employees, etc.


Service Offering Social Listening Consumer Insights Analytics And Reporting
This aptly crafted editable PPT deck contains fifteen slides. Our topic specific Service Offering Social Listening Consumer Insights Analytics And Reporting presentation deck helps devise the topic with a clear approach. We offer a wide range of custom made slides with all sorts of relevant charts and graphs, overviews, topics subtopics templates, and analysis templates. Speculate, discuss, design or demonstrate all the underlying aspects with zero difficulty. This deck also consists creative and professional looking slides of all sorts to achieve the target of a presentation effectively. You can present it individually or as a team working in any company organization.
Try Before you Buy Download Free Sample Product
Save Hours of Time
100% Editable
Compatible with Google Slides
-
Product Description
-
Our Service Offering Social Listening Consumer Insights Analytics And Reporting are topically designed to provide an attractive backdrop to any subject. Use them to look like a presentation pro.
-
Related keywords
Website analytics insight icon with progress report
Presenting this set of slides with name Website Analytics Insight Icon With Progress Report. The topics discussed in these slides are Website Analytics, Insight Icon, Progress Report. This is a completely editable PowerPoint presentation and is available for immediate download. Download now and impress your audience.
Try Before you Buy Download Free Sample Product
Save Hours of Time
100% Editable
Compatible with Google Slides
-
Product Description
-
Our Website Analytics Insight Icon With Progress Report are topically designed to provide an attractive backdrop to any subject. Use them to look like a presentation pro.


Multi levels analytics journey curve with insight
Presenting our set of slides with Multi Levels Analytics Journey Curve With Insight. This exhibits information on four stages of the process. This is an easy-to-edit and innovatively designed PowerPoint template. So download immediately and highlight information on Reporting, Analytics, Budget, Marketing Channels, Performance.
Try Before you Buy Download Free Sample Product
Save Hours of Time
100% Editable
Compatible with Google Slides
-
Product Description
-
Our Multi Levels Analytics Journey Curve With Insight are topically designed to provide an attractive backdrop to any subject. Use them to look like a presentation pro.

When To Use Descriptive Analytics Technique Data Driven Insights Big Data Analytics SS V
This slide highlights applications of descriptive analytics in business environment which helps in data driven decision making. It provides information regarding studying past data, effective reporting, decision making and benchmarking. Increase audience engagement and knowledge by dispensing information using When To Use Descriptive Analytics Technique Data Driven Insights Big Data Analytics SS V This template helps you present information on four stages. You can also present information on Study Past Data, Decision Making, Effective Reporting using this PPT design. This layout is completely editable so personaize it now to meet your audiences expectations.
Try Before you Buy Download Free Sample Product
Save Hours of Time
100% Editable
Compatible with Google Slides
-
Product Description
-
This slide highlights applications of descriptive analytics in business environment which helps in data driven decision making. It provides information regarding studying past data, effective reporting, decision making and benchmarking.
-
Related keywords

Comparative Assessment Of Descriptive Analytics Tools Data Driven Insights Big Data Analytics SS V
This slide showcases comparison of descriptive analytics tools used to develop business insights and effective reporting. It provides information regarding software, features, price, free trial and user ratings. Deliver an outstanding presentation on the topic using this Comparative Assessment Of Descriptive Analytics Tools Data Driven Insights Big Data Analytics SS V Dispense information and present a thorough explanation of Software, Analyze Large Datasets, Statistical Analysis using the slides given. This template can be altered and personalized to fit your needs. It is also available for immediate download. So grab it now.
Try Before you Buy Download Free Sample Product
Save Hours of Time
100% Editable
Compatible with Google Slides
-
Product Description
-
This slide showcases comparison of descriptive analytics tools used to develop business insights and effective reporting. It provides information regarding software, features, price, free trial and user ratings.

Key Steps To Develop Data Insights Using Leveraging Digital Analytics To Develop Data Analytics SS
This slide showcase various steps involved in driving valuable insights for business through using descriptive analytics techniques. It provides information regarding defining metrics for business, identifying data sources, gathering an preparing data, assessing data and develop data reports. Introducing Key Steps To Develop Data Insights Using Leveraging Digital Analytics To Develop Data Analytics SS to increase your presentation threshold. Encompassed with five stages, this template is a great option to educate and entice your audience. Dispence information on Define Metrics For Business, Gather And Prepare Data, Develop Data Report, Identify Data Sources, using this template. Grab it now to reap its full benefits.
Try Before you Buy Download Free Sample Product
Save Hours of Time
100% Editable
Compatible with Google Slides
-
Product Description
-
This slide showcase various steps involved in driving valuable insights for business through using descriptive analytics techniques. It provides information regarding defining metrics for business, identifying data sources, gathering an preparing data, assessing data and develop data reports.