

Top 10 Data Visualization Icons PowerPoint Presentation Templates in 2026
Unlock the power of your presentations with our Data Visualization Icons, designed to elevate your storytelling and make complex information easily digestible. These fully editable and customizable icons come in a variety of styles and formats, ensuring they seamlessly integrate into any PowerPoint presentation. Whether you're presenting data trends, statistical insights, or project milestones, our icons provide a visually appealing way to represent your data. Use cases for our Data Visualization Icons are vast and varied. For business professionals, they can enhance quarterly reports, making performance metrics more engaging and understandable. Educators can utilize these icons to illustrate concepts in a more interactive manner, helping students grasp challenging material. Marketers can leverage them to showcase campaign performance, customer demographics, or market research findings. Additionally, project managers can represent timelines, workflows, and resource allocations visually, streamlining communication with stakeholders. By incorporating our Data Visualization Icons into your presentations, you not only enhance clarity but also captivate your audience, making your message memorable and impactful. Transform your data into compelling visuals and ensure your insights resonate with every viewer!


Data Visualization Business Intelligence Monotone Icon In Powerpoint Pptx Png And Editable Eps Format
This Monotone Powerpoint Icon is perfect for Analysis Presentation. It features a graph with a magnifying glass, emphasizing the importance of data analysis. It is a great visual aid to help you convey your message and is sure to impress your audience.

Try Before you Buy Download Free Sample Product
 Save Hours of Time
 100% Editable
 Compatible with Google Slides
-
Product Description

-
This Data visualization business intelligence monotone icon in powerpoint pptx png and editable eps format is a 100 percent editable icon. The downloaded file will have this icon in EPS, PNG and Powerpoint pptx format and is perfect for your next project. It has a simple yet stylish design.
Data visualization icon four pie chart bar graph upward lines
Presenting this set of slides with name - Data Visualization Icon Four Pie Chart Bar Graph Upward Lines. This is a one stage process. The stages in this process are Data Visualization Icon, Data Management Icon.
Try Before you Buy Download Free Sample Product
Save Hours of Time
100% Editable
Compatible with Google Slides
-
Product Description
-
Energise your team into action. Plug them in with our Data Visualization Icon Four Pie Chart Bar Graph Upward Lines.
Data Visualization Integration Monotone Icon In Powerpoint Pptx Png And Editable Eps Format
This monotone PowerPoint icon is perfect for presentations on data integration. It features an abstract image of two arrows crossing each other, symbolizing the combining of data from different sources. The icon is simple and modern, making it easy to integrate into any presentation.
Try Before you Buy Download Free Sample Product
Save Hours of Time
100% Editable
Compatible with Google Slides
-
Product Description
-
This Data visualization integration monotone icon in powerpoint pptx png and editable eps format is a 100 percent editable icon. The downloaded file will have this icon in EPS, PNG and Powerpoint pptx format and is perfect for your next project. It has a simple yet stylish design.
Data visualization icon in circular manner
Presenting this set of slides with name - Data Visualization Icon In Circular Manner. This is a three stage process. The stages in this process are Data Visualization Icon, Data Management Icon.
Try Before you Buy Download Free Sample Product
Save Hours of Time
100% Editable
Compatible with Google Slides
-
Product Description
-
Address the cause of illogical conclusions with our Data Visualization Icon In Circular Manner. Focus on irrational beliefs.
Icons Slides For Data Visualization
Introducing our well researched set of slides titled Icons Slides For Data Visualization. It displays a hundred percent editable icons. You can use these icons in your presentation to captivate your audiences attention. Download now and use it multiple times.
Try Before you Buy Download Free Sample Product
Save Hours of Time
100% Editable
Compatible with Google Slides
-
Product Description
-
Our Icons Slides For Data Visualization are topically designed to provide an attractive backdrop to any subject. Use them to look like a presentation pro.
-
Related keywords
Visualizing Data On Computer Monotone Icon In Powerpoint Pptx Png And Editable Eps Format
Make your presentation profoundly eye-catching leveraging our easily customizable Visualizing data on computer monotone icon in powerpoint pptx png and editable eps format. It is designed to draw the attention of your audience. Available in all editable formats, including PPTx, png, and eps, you can tweak it to deliver your message with ease.
Try Before you Buy Download Free Sample Product
Save Hours of Time
100% Editable
Compatible with Google Slides
-
Product Description
-
This Visualizing data on computer monotone icon in powerpoint pptx png and editable eps format is a 100 percent editable icon. The downloaded file will have this icon in EPS, PNG and Powerpoint pptx format and is perfect for your next project. It has a simple yet stylish design.
-
Related keywords


Advanced Data Analytics Visualization Tools Icon
Introducing our Advanced Data Analytics Visualization Tools Icon set of slides. The topics discussed in these slides are Advanced Data Analytics, Visualization Tools Icon. This is an immediately available PowerPoint presentation that can be conveniently customized. Download it and convince your audience.
Try Before you Buy Download Free Sample Product
Save Hours of Time
100% Editable
Compatible with Google Slides
-
Product Description
-
Our Advanced Data Analytics Visualization Tools Icon are topically designed to provide an attractive backdrop to any subject. Use them to look like a presentation pro.
-
Related keywords
Icons Slide For Data Visualizations Playbook
Presenting our well crafted Icons Slide For Data Visualizations Playbook set of slides. The slides include icons that are innovatively designed by our team of experts. The icons are easy to edit so you can conveniently increase or decrease their size without any loss in resolution. Therefore, grab them instantly.
Try Before you Buy Download Free Sample Product
Save Hours of Time
100% Editable
Compatible with Google Slides
-
Product Description
-
Our Icons Slide For Data Visualizations Playbook are topically designed to provide an attractive backdrop to any subject. Use them to look like a presentation pro.
Financial data search global finance investment data search analysis ppt icons graphics
Presenting financial data search global finance investment data search analysis ppt icons graphics. This Power Point icons template has been crafted with graphic of finance and data icons. This icon PPT contains the concept of financial data search and investment analysis. Use this icon PPT for business and finance related presentations.
Try Before you Buy Download Free Sample Product
Save Hours of Time
100% Editable
Compatible with Google Slides
-
Product Description
-
Find all your presentation solutions in our vast collection of Financial Data Search Global Finance Investment Data Search Analysis Ppt Icons Graphics. We have a slide for every theme.
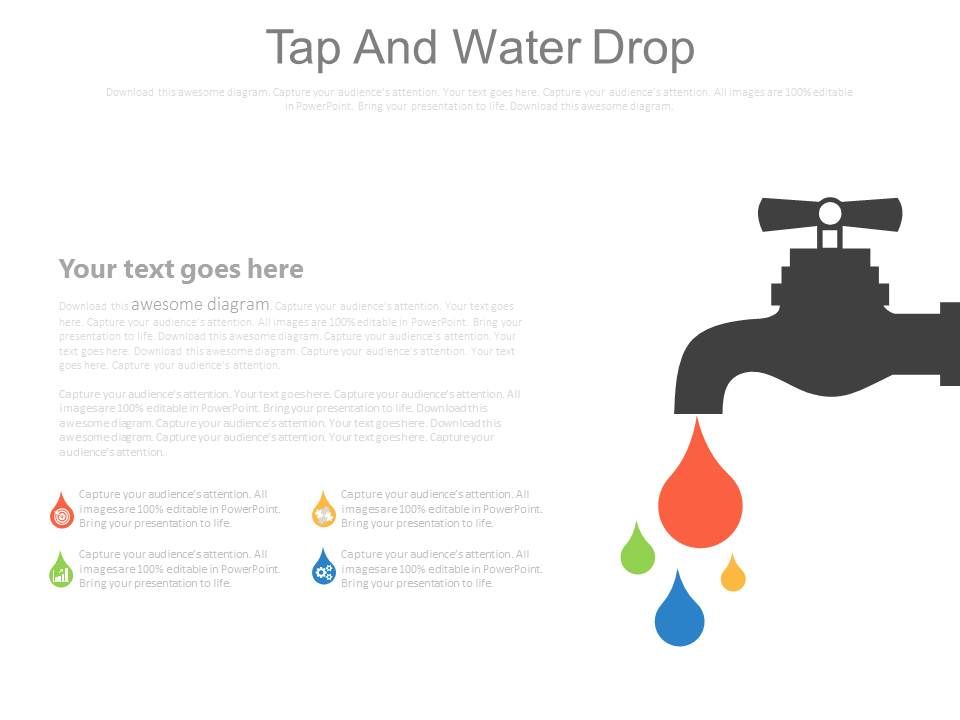


Tap and water drop diagram for data powerpoint slides
Brimming with aesthetic appeal and professional parameters. Uncluttered and intense projection of relevant visuals. Harmonious use of PPT icons, colors, fonts and designs with respect to the subject. Freedom to execute changes in slide background as per individual’s preference. Flexibility to customize it with company specific elements like name, logo and trademark. Compatibility with multiple software and format options. High resolution and stupendous quality visuals. Used by several business strategists, stakeholders, managers, students, financiers, sales professionals and entrepreneurs.
Try Before you Buy Download Free Sample Product
Save Hours of Time
100% Editable
Compatible with Google Slides
-
Product Description
-
Use of abstract visuals in PowerPoint presentations has its own share of pros and cons attached to it. For example, our tap and water drop diagram for data PowerPoint slides. If the provided PPT presentation layout is used by a creative and intelligent professional who knows to add ideas and concepts to this PPT model then the outcome is stupendous. Otherwise the presentation looses upon its hold on the topic. You as a business professional can make use of the tap and water PPT presentation PowerPoint visual to denote the churning of any process whose outcomes can be depicted in form of water droplets. Also you may use the tap water PowerPoint slide design background to mention the branches of any system by way of droplets and the tap mouth can represent the system itself. Apply the concept of tap as producer and water as produce or product of this process. Since the visual is vector based, you may use it any size as desired from your end. Simply click, download, save, personalize and present. Take the extra moment to make your presentation perfect. Our beautiful Tap And Water Drop Diagram For Data Powerpoint Slides are ready in seconds.
-
Related keywords