

Top 10 Icon depicting operations dashboard monitoring PowerPoint Presentation Templates in 2026
An operations dashboard monitoring icon serves as a vital visual element in PowerPoint presentations, particularly for businesses looking to streamline their operational efficiency. This icon typically represents a centralized platform where key performance indicators (KPIs) are tracked in real-time, offering a comprehensive overview of various operational metrics. By utilizing this icon in your PPT, you can effectively communicate the importance of monitoring critical business processes, such as inventory levels, production rates, and service delivery times.Incorporating an operations dashboard monitoring icon into your presentation can enhance audience engagement by visually summarizing complex data. It allows stakeholders to quickly grasp the current state of operations, identify trends, and make informed decisions based on real-time insights. Use cases for this icon extend across various industries, including manufacturing, logistics, and customer service, where operational efficiency is paramount. By showcasing the dashboards capabilities, you can illustrate how organizations can proactively address challenges, optimize workflows, and ultimately drive better business outcomes. This visual representation not only aids in conveying information but also inspires confidence in data-driven decision-making, making it an essential component of any operational strategy presentation.


Icon Depicting Operations Dashboard Monitoring
Presenting our set of slides with name Icon Depicting Operations Dashboard Monitoring. This exhibits information on three stages of the process. This is an easy to edit and innovatively designed PowerPoint template. So download immediately and highlight information on Icon Depicting Operations, Dashboard Monitoring.

Try Before you Buy Download Free Sample Product
 Save Hours of Time
 100% Editable
 Compatible with Google Slides
-
Product Description

-
Our Icon Depicting Operations Dashboard Monitoring are topically designed to provide an attractive backdrop to any subject. Use them to look like a presentation pro.


Dashboard Depicting Project Task Management
This slide focuses on the project task management dashboard which includes availability, time tracking regarding the efficiency of employees, weekly tasks such as scheduling meeting, monitoring budget, developing animation, etc, with status percentage. Presenting our well structured Dashboard Depicting Project Task Management. The topics discussed in this slide are Management, Dashboard, Availability. This is an instantly available PowerPoint presentation that can be edited conveniently. Download it right away and captivate your audience.
Try Before you Buy Download Free Sample Product
Save Hours of Time
100% Editable
Compatible with Google Slides
-
Product Description
-
This slide focuses on the project task management dashboard which includes availability, time tracking regarding the efficiency of employees, weekly tasks such as scheduling meeting, monitoring budget, developing animation, etc, with status percentage.
-
Related keywords


Dashboard To Monitor Supplier Chains Warehouse Operations
Following slide depicts a dashboard which can be used by supplier to get a centralized, real time view of key metrics and data points related to the logistics performance. Key performance metrics are related to due receipts, number of products received,items in transit, items due for pickup etc. Introducing our Dashboard To Monitor Supplier Chains Warehouse Operations set of slides. The topics discussed in these slides are Product Status, Best Selling Products, Transactions Completed. This is an immediately available PowerPoint presentation that can be conveniently customized. Download it and convince your audience.
Try Before you Buy Download Free Sample Product
Save Hours of Time
100% Editable
Compatible with Google Slides
-
Product Description
-
Following slide depicts a dashboard which can be used by supplier to get a centralized, real time view of key metrics and data points related to the logistics performance. Key performance metrics are related to due receipts, number of products received,items in transit, items due for pickup etc.
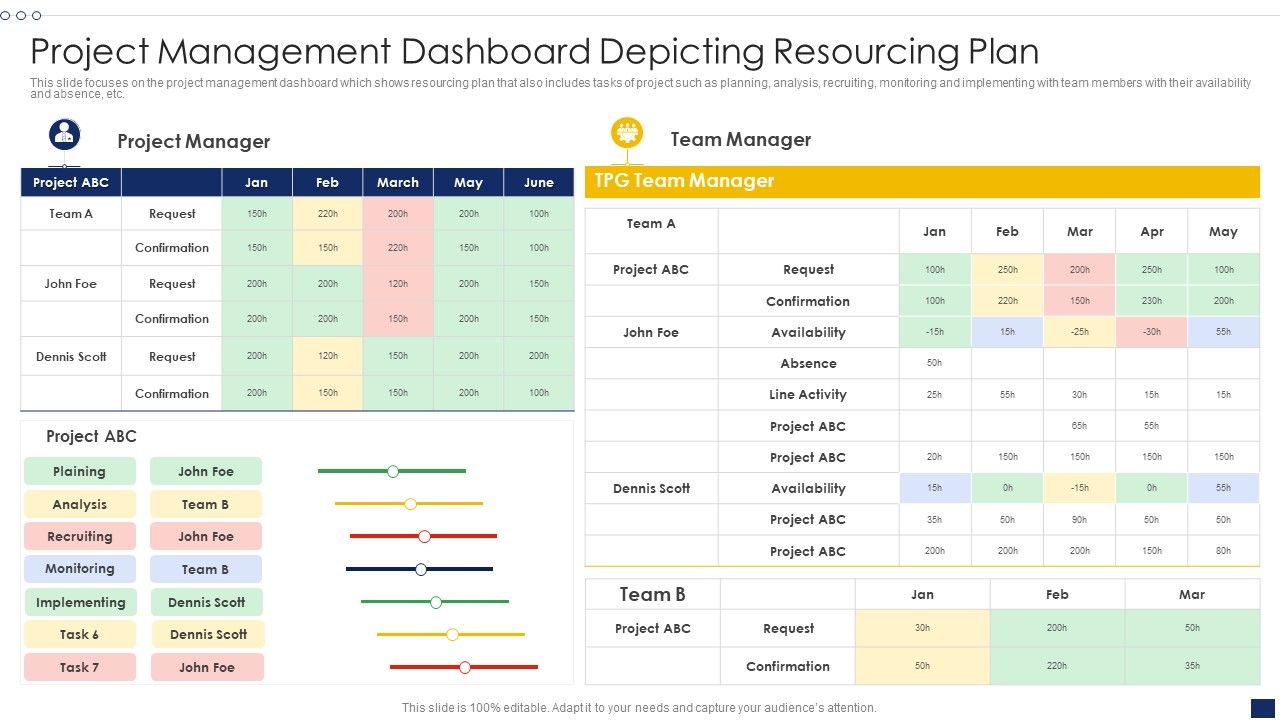
Project Management Dashboard Depicting Resourcing Plan
This slide focuses on the project management dashboard which shows resourcing plan that also includes tasks of project such as planning, analysis, recruiting, monitoring and implementing with team members with their availability and absence, etc. Introducing our Project Management Dashboard Depicting Resourcing Plan set of slides. The topics discussed in these slides are Project Manager, Team Manager, Project ABC. This is an immediately available PowerPoint presentation that can be conveniently customized. Download it and convince your audience.
Try Before you Buy Download Free Sample Product
Save Hours of Time
100% Editable
Compatible with Google Slides
-
Product Description
-
This slide focuses on the project management dashboard which shows resourcing plan that also includes tasks of project such as planning, analysis, recruiting, monitoring and implementing with team members with their availability and absence, etc.


Dashboard To Monitor Global Footprint Of Supply Chain Operations
This slide depicts a dashboard that will be used by managers to monitor the global footprint of supply chain operations. Major key performance indicators include total global emissions, time frame, allocation, electricity, etc.Introducing our Dashboard To Monitor Global Footprint Of Supply Chain Operations set of slides. The topics discussed in these slides are Dashboard Monitor, Global Footprint, Supply Chain Operations . This is an immediately available PowerPoint presentation that can be conveniently customized. Download it and convince your audience.
Try Before you Buy Download Free Sample Product
Save Hours of Time
100% Editable
Compatible with Google Slides
-
Product Description
-
This slide depicts a dashboard that will be used by managers to monitor the global footprint of supply chain operations. Major key performance indicators include total global emissions, time frame, allocation, electricity, etc.
-
Related keywords

Driver Monitoring System Block Diagram
This slide represents block diagram of driver monitoring system. It depicts data related to NXP and Non NXP and other technology and shows transfer of data from motion sensor and PMIC to MCU MPU etc. Presenting our well structured Driver Monitoring System Block Diagram. The topics discussed in this slide are Driver Monitoring System, Block Diagram. This is an instantly available PowerPoint presentation that can be edited conveniently. Download it right away and captivate your audience.
Try Before you Buy Download Free Sample Product
Save Hours of Time
100% Editable
Compatible with Google Slides
-
Product Description
-
This slide represents block diagram of driver monitoring system. It depicts data related to NXP and Non NXP and other technology and shows transfer of data from motion sensor and PMIC to MCU MPU etc.
-
Related keywords
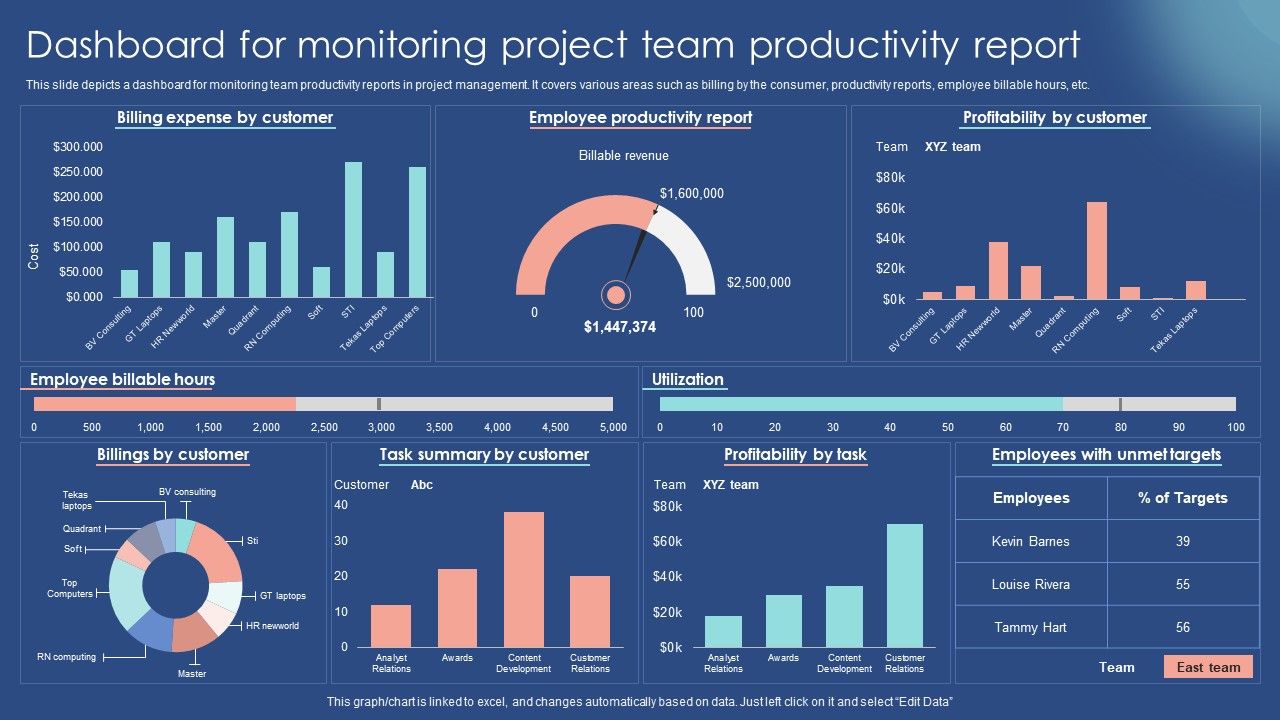

Dashboard For Monitoring Project Team Productivity Report
This slide depicts a dashboard for monitoring team productivity reports in project management. It covers various areas such as billing by the consumer, productivity reports, employee billable hours, etc. Presenting our well structured Dashboard For Monitoring Project Team Productivity Report. The topics discussed in this slide are Profitability By Customer, Profitability By Task, Summary By Customer. This is an instantly available PowerPoint presentation that can be edited conveniently. Download it right away and captivate your audience.
Try Before you Buy Download Free Sample Product
Save Hours of Time
100% Editable
Compatible with Google Slides
-
Product Description
-
This slide depicts a dashboard for monitoring team productivity reports in project management. It covers various areas such as billing by the consumer, productivity reports, employee billable hours, etc.

Monitoring And Controlling Project Operation Management Flow Chart
This slide depicts the flowchart for management of project operations and monitoring which assist in to boost productivity and quality assurance. It passes through various stages such as performance report, testing, training, etc. Introducing our premium set of slides with Monitoring And Controlling Project Operation Management Flow Chart. Ellicudate the one stages and present information using this PPT slide. This is a completely adaptable PowerPoint template design that can be used to interpret topics like Performance Report, Security Final Approval, Quality Check. So download instantly and tailor it with your information.
Try Before you Buy Download Free Sample Product
Save Hours of Time
100% Editable
Compatible with Google Slides
-
Product Description
-
This slide depicts the flowchart for management of project operations and monitoring which assist in to boost productivity and quality assurance. It passes through various stages such as performance report, testing, training, etc.


Workforce Appraisal Status Monitoring KPI Dashboard Successful Employee Performance
The following slide depicts the overview of employee appraisal tracking summary to align goals and system. It includes key elements such as stages, employee ID, name, feedback status pending, done, due etc. Present the topic in a bit more detail with this Workforce Appraisal Status Monitoring KPI Dashboard Successful Employee Performance. Use it as a tool for discussion and navigation on FBP Validation And Approval, Feedback, Review. This template is free to edit as deemed fit for your organization. Therefore download it now.
Try Before you Buy Download Free Sample Product
Save Hours of Time
100% Editable
Compatible with Google Slides
-
Product Description
-
The following slide depicts the overview of employee appraisal tracking summary to align goals and system. It includes key elements such as stages, employee ID, name, feedback status pending, done, due etc.


Workforce Appraisal Status Monitoring Kpi Dashboard Implementing Effective Performance
The following slide depicts the overview of employee appraisal tracking summary to align goals and system. It includes key elements such as stages, employee ID, name, feedback status pending, done, due etc. Present the topic in a bit more detail with this Workforce Appraisal Status Monitoring Kpi Dashboard Implementing Effective Performance. Use it as a tool for discussion and navigation on Process Workflow, Feedback Loop, Monitor This template is free to edit as deemed fit for your organization. Therefore download it now.
Try Before you Buy Download Free Sample Product
Save Hours of Time
100% Editable
Compatible with Google Slides
-
Product Description
-
The following slide depicts the overview of employee appraisal tracking summary to align goals and system. It includes key elements such as stages, employee ID, name, feedback status pending, done, due etc.
-
Related keywords